In the configuration file, the following sections should be defined:
Header
  <?xml version="1.0" encoding="UTF-8" ?>
  <JPSreport project="JPS-Project" version="0.8" xmlns:xsi="http://www.w3.org/2001/XMLSchema-instance" xsi:noNamespaceSchemaLocation="https://github.com/JuPedSim/jpsreport/blob/develop/xsd/jps_report.xsd">
Logfile
It might be useful to precise a logfile (for debugging purposes):
<logfile>log.txt</logfile>
Geometry
indicates the file name corresponding to the trajectory files to analyze.
<geometry file = "geo_KO_240_050_240.xml" />
The location can be either absolute path or relative path to the location of the inifile. A path is considered absolute if it starts with “/” (Linux system) or contains “:” (Windows system).
<geometry file = "geo/geo_KO_240_050_240.xml" />
Output
indicates the location of the output files based on the location of inifile or the absolute path.
<output location="Output/"/>
A path is considered absolute if it starts with “/” (Linux system) or contains “:” (Windows system).
Trajectories
indicates the location and the name of the trajectory files that will be analyzed.
The format of trajectory files should be .txt or .xml.
The supported unit of the trajectories is m.
Two other sub-options file and path can be supplied.
If only path is given, then all files with the corresponding format in
the given folder will be considered as the upcoming trajectories
and JPSreport will try to load them one by one.
If both file and path are given, then only the given trajectories
will be considered (several file tags can be given at the same time).
The location can be either absolute path or relative path to the location of the inifile. A path is considered absolute if it starts with “/” (Linux system) or contains “:” (Windows system).
For example:
  <trajectories format="txt" unit="m">
      <file name="traj_KO_240_050_240.txt" />
      <file name="traj_KO_240_060_240.txt" />
      <path location="./" />
  </trajectories>
Scripts [removed since 0.8.5]
gives relative path based on the location of inifile or the absolute path.
<scripts location="../../scripts/"/>
Measurement area
Indicates the types and location of the measurement areas you plan to use for analysis. Mainly two kind of measurement areas can be defined:
area_B: a 2D area and can be polygon (the orientation of its points is clockwise)area_L: a reference segment line defined by two points.
area_L is only used in method A, while area_B is used for method B, method C and method D.
Several measurement areas can be given and distinguished with different id.
The parameter zPos is used to indicate the position of measurement area in z axis. zPos is useful for geometry with several stories.
Notes:
- the option
length_in_movement_directionis only used in method B and the value will be ignored in other methods. - If not given in method_B, the effective distance between entrance point to the measurement area and the exit point from the measurement area will be used.
  <measurement_areas unit="m">
      <area_B id="1" type="BoundingBox" zPos="None">
          <vertex x="-2.40" y="1.00" /> <!-- Clockwise -->
          <vertex x="-2.40" y="3.00" />
          <vertex x="0" y="3.00" />
          <vertex x="0" y="1.00" />
          <length_in_movement_direction distance="2.0" />
      </area_B>
      <area_L id="2" type="Line" zPos="None">
          <start x="-2.40" y="1.00" />
          <end x="0" y="1.00" />
      </area_L>
      <area_L id="3" type="Line" zPos="None">
          <start x="-2.40" y="2.00" />
          <end x="0" y="2.00" />
      </area_L>
  </measurement_areas>
Velocity
precises the method for calculating the instantaneous velocity of pedestrian at time from trajectories:
  <velocity frame_step="10" set_movement_direction="None"
            ignore_backward_movement="false"/>
Possible parameters are
frame_stepgives the size of time interval for calculating the velocity. The default value is 10.set_movement_directionindicates in which direction the velocity will be projected. The value ofset_movement_directioncan be:None, which means that you don’t consider the movement direction and calculate the velocity by the real distance. This is the default value.- Any real number from
0to360which represents the angular information of the direction in the coordination system. Note that the axis can be represented either byX+,Y+,X-,Y-or by 0, 90, 180, 270. SeeTraj. For complex trajectories with several times of direction change, you can indicate the detailed direction using the angular information in the trajectory file (By adding a new column in.txtfile or adding a new variable in.xmlfile with the indicatorVD).
ignore_backward_movementindicates whether you want to ignore the movement opposite to the direction fromset_movement_direction. The default value isfalse.
Methods
Indicates the parameters related to each measurement method.
Six different methods method_A to method_D and Method_I to Method_J are integrated in the current
version of JPSreport and can be chosen for the analysis. The five methods method_A to method_D and method_J are used to analyze the steady state.
| Method | measurement area | output data |
|---|---|---|
| A | 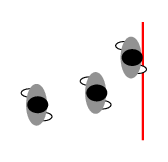 |
and |
| B | 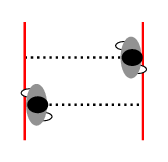 |
and |
| C | 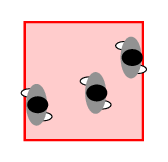 |
and |
| D |  |
and |
| J | |
and |
Further information relating to each method can be found in Pedestrian fundamental diagrams: Comparative analysis of experiments in different geometries.
Method_I can be used for time-series analysis of individual data.
Method A
For definition see Method A. Method A is used to analyze the steady state.
  <method_A enabled="true">
    <measurement_area id="2" frame_interval="100"/>
    <measurement_area id="3" frame_interval="100"/>
  </method_A>
Possible parameters are:
-
idspecifies the location of the reference line. several measurement areas can be set in one inifile with different id-numbers. -
frame_intervalspecifies the size of time interval (in frame) for calculating flow rate. -
up to version 0.8.5:
plot_time_seriesspecifies whether output the ()-Diagram.
Possible output data are:
/Fundamental_Diagram/FlowVelocity/: the output filesFlow_NT_traj_andFDFlowVelocity_traj_.
Method B
For definition see Method B. Method B is used to analyze the steady state.
  <method_B enabled="false">
      <measurement_area id="1" />
  </method_B>
This method can only be used to analyze one directional (or part of one directional) pedestrian movement in corridors. The speed is defined by the length of the measurement area length_in_movement_direction and the time a pedestrian stays in the area.
Possible parameters are:
measurement_areagiven by anidnumber. Note that the measurement area for method_B should be rectangle based on the definition of the method.
Possible output data are:
/Fundamental_Diagram/TinTout/: output fileFDTinTout_traj_with mean density and velocity of each pedestrian (PersID, and ).
Method C
For definition see Method C. Method C is used to analyze the steady state.
  <method_C enabled="true">
      <measurement_area id="1"/>
  </method_C>
Possible parameters are:
-
idindicates the size and location of the measurement_area. Several measurement areas can be set in one inifile. -
up to version 0.8.5:
plot_time_seriesspecifies whether output the () and () diagrams.
Possible output data are:
/Fundamental_Diagram/Classical_Voronoi/: output filerho_v_Classic_traj_with mean density and velocity of over time (frame, , ).
Method D
For definition see Method D. Method D is used to analyze the steady state.
 <method_D enabled="true">
   <measurement_area id="1" start_frame="None" stop_frame="None"
         get_individual_FD="false"/>
   <one_dimensional enabled="false"/>
   <cut_by_circle enabled="false" radius="1.0" edges="10"/>
   <profiles enabled="false" grid_size_x="0.20" grid_size_y="0.20"/>
 </method_D>
Possible parameters are:
-
For each
measurement_area, several id numbers can be set in one inifile.start_frameandstop_framegive the starting and ending frame for data analysis. The default values of these two parameters areNone. If you plan to analysis the whole run from beginning to the end, set both ofstart_frameandstop_frameasNone; Ifstart_frame =Nonebutstop_frameis not, then analysis will be performed from beginning of the trajectory to thestop_frame. Ifstart_frameis notNonebutstop_frame = None, it will analyze from thestart_frameto the end of the movement.get_individual_FDdetermines whether or not to output the data for individual fundamental diagram in the given measurement area, which is based on the Voronoi density , velocity , position (, and ) and Voronoi polygon of each pedestrian in a given measurement area but not mean value over space. If true, the related data will be written in the folder./Output/Fundamental_Diagram/IndividualFD/in the output fileIFD_D_. -
up to version 0.8.5:
plot_time_seriesspecifies whether output the and -diagram. -
one_dimensionalshould be used when pedestrians move on a line single-file experiment. -
cut_by_circledetermines whether to cut each cell by circle or not. Two optionsradiusof the circle and the number ofedgeshave to be supplied for approximating the circle ifenabledis true. -
up to version 0.8.5:
output_voronoi_cellsspecifies whether or not to output data for visualizing the Voronoi diagram. Two optionsenabledandplot_graphshave to be set. If both of them aretrue, files including Voronoi cells, speed and the coordinates of pedestrian corresponding to each cell as well as the figures of Voronoi cells will be created in the folder./Output/Fundamental_Diagram/Classical_Voronoi/VoronoiCell/. If the latter isfalse, only the data will be created but the figures will not be plotted. Whenenableisfalse, nothing will be created. -
profilesindicates whether to calculate the profiles over time and space. Ifenabledis true, the resolution which is decided by the parametersgrid_size_xandgrid_size_xshould be set. The data will be in the folder.
Possible output data are:
/Fundamental_Diagram/Classical_Voronoi/: output filerho_v_Voronoi_with mean density and velocity of over time (frame, , )./Fundamental_Diagram/IndividualFD/: output fileIFD_D_with Voronoi density , velocity , position (, and ) and Voronoi polygon of each pedestrian ../Output/Fundamental_ Diagram/Classical_Voronoi/field/:- output file
Prf_d_contains the profile data for density. - output file
Prf_v_contains the profile data for velocity.
- output file
- The output folder
./Output/Fundamental_ Diagram/Classical_Voronoi/VoronoiCell/contains the data for plotting the Voronoi cells.
Method I
Method I use the definition of Method D. For definition see Method D. Method I can be used for time-series analysis of individual data.
 <method_I enabled="true">
   <measurement_area id="1" start_frame="None" stop_frame="None"/>
   <cut_by_circle enabled="true" radius="1.0" edges="10"/>
 </method_I>
Possible parameters are:
-
For each
measurement_area, several id numbers can be set in one inifile.start_frameandstop_framegive the starting and ending frame for data analysis. The default values of these two parameters areNone. If you plan to analysis the whole run from beginning to the end, set both ofstart_frameandstop_frameasNone; Ifstart_frame = Nonebutstop_frameis not, then analysis will be performed from beginning of the trajectory to thestop_frame. Ifstart_frameis notNonebutstop_frame = None, it will analyze from thestart_frameto the end of the movement. -
cut_by_circledetermines whether to cut each cell by circle or not. Two optionsradiusof the circle and the number ofedgeshave to be supplied for approximating the circle ifenabledis true.
The data are saved in the output folder: /Fundamental_Diagram/IndividualFD/ in the output file IFD_I_ with
Voronoi density , velocity , position (, and ) and Voronoi polygon of each pedestrian .
Method J
For definition see Method J. Method J is used to analyze the steady state.
 <method_J enabled="true">
   <measurement_area id="1" start_frame="None" stop_frame="None"
         get_individual_FD="false"/>
   <one_dimensional enabled="false"/>
   <cut_by_circle enabled="false" radius="1.0" edges="10"/>
   <profiles enabled="false" grid_size_x="0.20" grid_size_y="0.20"/>
 </method_J>
Possible parameters are:
- For each
measurement_area, several id numbers can be set in one inifile.-
start_frameandstop_framegive the starting and ending frame for data analysis. The default values of these two parameters areNone. If you plan to analysis the whole run from beginning to the end, set both ofstart_frameandstop_frameasNone; Ifstart_frame =Nonebutstop_frameis not, then analysis will be performed from beginning of the trajectory to thestop_frame. Ifstart_frameis notNonebutstop_frame = None, it will analyze from thestart_frameto the end of the movement. -
get_individual_FDdetermines whether or not to output the data for individual fundamental diagram in the given measurement area, which is based on the Voronoi density , velocity , position (, and ) and Voronoi polygon of each pedestrian in a given measurement area but not mean value over space. If true, the related data will be written in the folder./Output/Fundamental_Diagram/IndividualFD/in the output fileIFD_J_.
-
-
one_dimensionalshould be used when pedestrians move on a line single-file experiment. -
cut_by_circledetermines whether to cut each cell by circle or not. Two optionsradiusof the circle and the number ofedgeshave to be supplied for approximating the circle ifenabledis true. profilesindicates whether to calculate the profiles over time and space. Ifenabledis true, the resolution which is decided by the parametersgrid_size_xandgrid_size_xshould be set.
Possible output data are:
/Fundamental_Diagram/Classical_Voronoi/: output filerho_v_Voronoi_J_with mean density and velocity of over time (frame, , )./Fundamental_Diagram/IndividualFD/: output fileIFD_J_with Voronoi density , velocity , position (, and ) and Voronoi polygon of each pedestrian ../Output/Fundamental_ Diagram/Classical_Voronoi/field/:- output file
Prf_d_contains the profile data for density. - output file
Prf_v_contains the profile data for velocity.
- output file
- The output folder
./Output/Fundamental_ Diagram/Classical_Voronoi/VoronoiCell/contains the data for plotting the Voronoi cells.