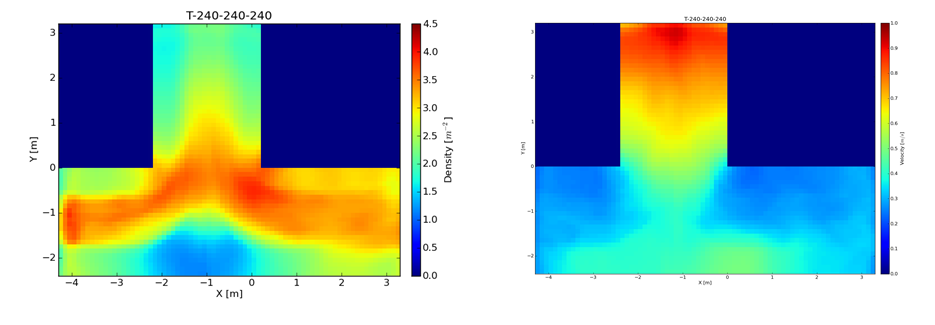
This page shows how to get profiles of density, velocity and specific flow. Here is an example extracted from a T-Junction experiment:
Run jpsreport
Run JPSreport as described in getting fundamental diagram.
In order to calculate the profiles it is mandatory to use method D.
Moreover, Set the parameter enabled of profiles to true.
Set the resolution of the profile by initializing the two parameters grid_size_xand grid_size_y, e.g.:
 <method_D enabled="true">
   <profiles enabled="true" grid_size_x="0.20" grid_size_y="0.20"/>
 </method_D>
(optional) Steady state
Determine the steady state of the experiment in the whole measurement region. In the folder script there is a script to fulfill this task semi-manually.
Produce the profiles
Run the python script _Plot_profiles.py, which is in the scripts folder in JPSreport.